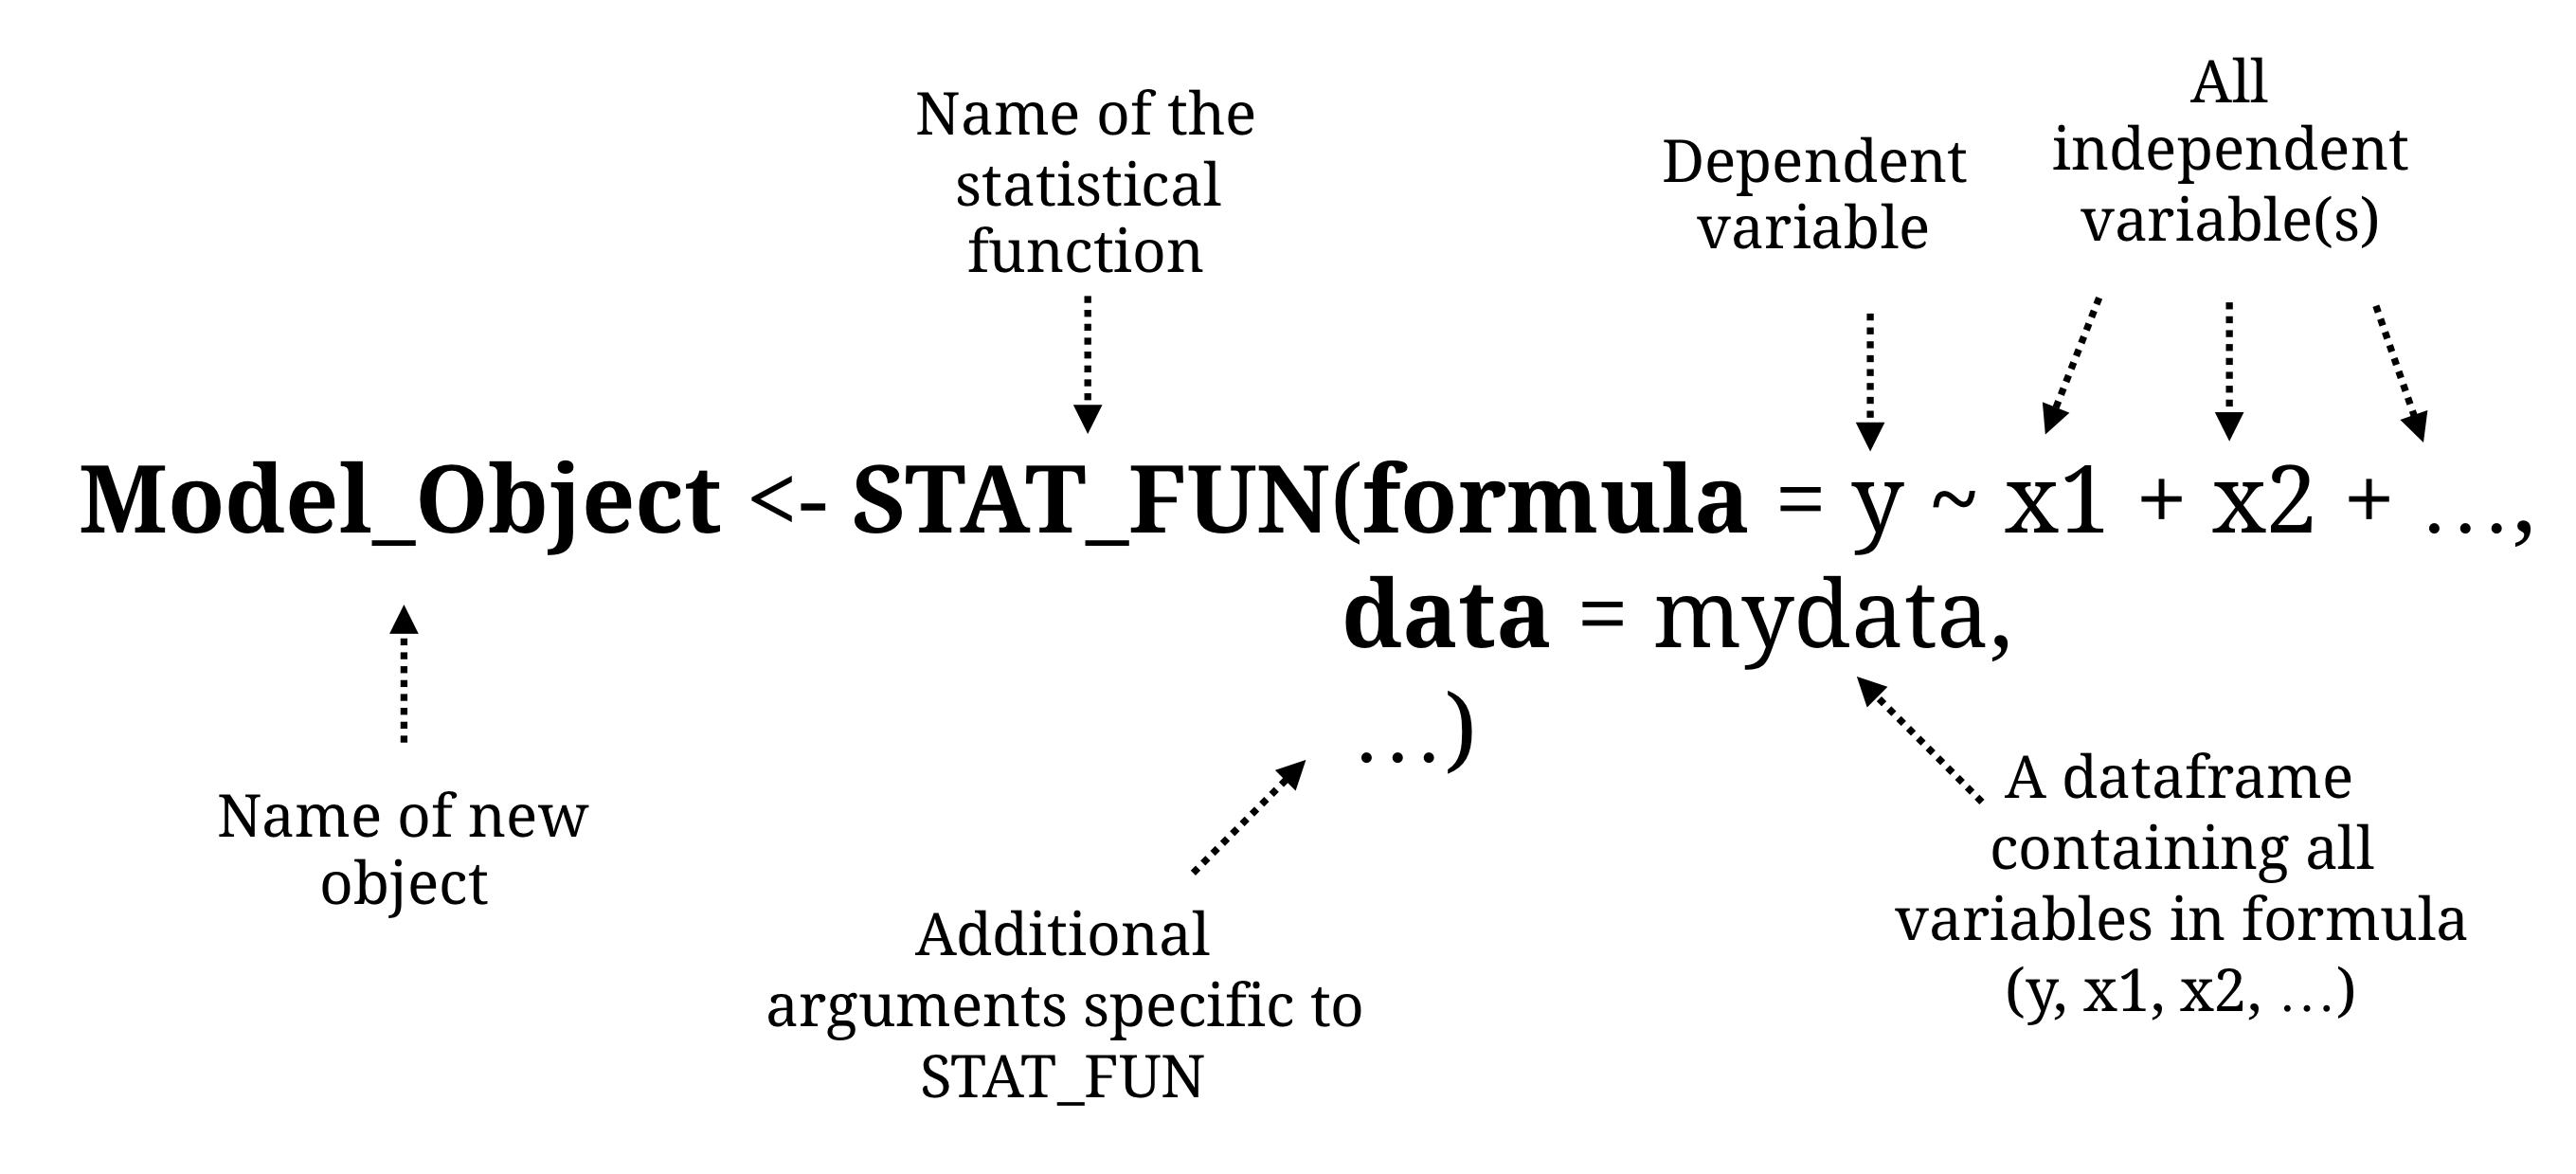
class: center, middle, inverse, title-slide # Recap II ## First Weekend ### Basel R Bootcamp<br/><a href='https://therbootcamp.github.io'>www.therbootcamp.com</a><br/><a href='https://twitter.com/therbootcamp'><span class="citation">@therbootcamp</span></a> ### July 2018 --- # Essentials: The 2<sup>4</sup> Lessons of the R Bootcamp .pull-left4[ 1. Everything is an object 2. Use `<-` to create/change objects 3. Name objects using `_` 4. Objects have classes 5. Everything happens through functions 6. Functions have (default) arguments 7. Functions expect certain object classes 8. View help files using `?` 9. Study errors and warnings 10. Data is stored in data frames 11. Select variables (vectors) using `$` 12. Use RStudio and projects 13. Use editor and shortcuts 14. First load packages and data 15. Use auto-complete 16. Comment and format for readability ] --- # 3 Object types for data .pull-left4[ R has 3 main data objects... <high>`list`</high> - R's multi-purpose container - Can carry any data, incl. lists - Often used for function outputs <high>`data_frame`</high> - R's spreadsheet - Specific type of `list` - Typical data format - For multi-variable data sets <high>`vectors`</high> - R's data container - Actually carries the data - Contain data of 1 of many types ] .pull-right55[ <img src="https://raw.githubusercontent.com/therbootcamp/therbootcamp.github.io/master/_sessions/_image/main_objects.png"></img> ] --- # Data Input/Output .pull-left45[ Raw data can come in many shapes and sizes, but <high>R's got you covered</high>. <br><br> .pull-left65[ | Package | Description| |:----------------|:-------------------------------------------------------| | `readr`| `.csv`, `.txt`, etc. | | `haven`| `.sav`, `.sas7bdat`, `.dta` | | `readxl` | `.xls`, `.xlsx` | | `R.matlab` | `.mat` | | `jsonlite` | `.json` | | `rvest` | `.html` | | `XML`, `xml2` | `.xml` | ] ] .pull-right45[ <img src="http://blog.datasift.com/wp-content/uploads/2014/10/ms-files-3.jpg"> ] --- # Finding the file path .pull-left4[ 1 - Identify the file path using the <high>auto-complete</high>. 2 - Initiate auto-complete and browse through the folder structure by placing the cursor between two quotation marks and using the <high>tab key</high>. <p align="center"> <img src="https://raw.githubusercontent.com/therbootcamp/therbootcamp.github.io/master/_sessions/_image/tab.png" height="80px"></img> </p> 3 - Auto-complete begins with the project folder - <high>place your data inside your project folder!</high> ] .pull-right55[ <img src="https://raw.githubusercontent.com/therbootcamp/therbootcamp.github.io/master/_sessions/_image/load_baselers_ss.jpg"></img> ] --- .pull-left45[ # What is wrangling? <font size = 5><high>Transform</high></font> Change column names Add new columns <font size = 5><high>Organise</high></font> Sort data by columns Merging data from two separate dataframes Move data between columns and rows <font size = ><high>Aggregate</high></font> Group data and summarise ] .pull-right5[ <br> <p align="center"> <img src="https://raw.githubusercontent.com/therbootcamp/therbootcamp.github.io/master/_sessions/_image/organise_transform_aggregate.png" height = "550px"> </p> ] --- # Wrangling .pull-left4[ 1 - Start by assigning your result to a new object to save it! 2 - "Keep the pipe <high>%>%</high> going" to continue working with your data frame. 3 - The output of dplyr functions will (almost) always be a <high>tibble</high>. 4 - You can almost always include <high>multiple operations</high> within each function. ] .pull-right55[ ```r # Assign result to baslers_agg baslers_agg <- baselers %>% # Change column names with rename() rename(age_years = age, weight_kg = weight) %>% # PIPE! # Select specific rows with filter() filter(age_years < 40) %>% # PIPE! # Create new columns witb mutate() mutate(debt_ratio = debt / income) %>% # PIPE! # Group data with group_by() group_by(sex) %>% # PIPE! # Calculate summary statistics with summarise() summarise(income_mean = mean(income), debt_mean = mean(debt), dr_mean = mean(dr)) ``` ] --- # Stats? There is a package for that! .pull-left45[ <br> | Package| Models| |------:|:----| | `stats`|Generalized linear model| | `afex`| Anovas| | `lme4`| Mixed effects regression| | `rpart`| Decision Trees| | `BayesFactor`| Bayesian statistics| | `igraph`| Network analysis| | `neuralnet`| Neural networks| | `MatchIt`| Matching and causal inference| | `survival`| Longitudinal survival analysis| | ...| Anything you can ever want!| ] .pull-right5[ <p align="center"> <img src="https://raw.githubusercontent.com/therbootcamp/therbootcamp.github.io/master/_sessions/_image/statistical_procedures.png" height="450px" vspace="20"> </p> ] --- # Basic structure of statistical functions .pull-left4[ Statistical functions always require a <high>data frame</high> called `data`, e.g.,... |sex | age| height| weight| income| |:------|---:|------:|------:|------:| |male | 44| 174.3| 113.4| 6300| |male | 65| 180.3| 75.2| 10900| |female | 31| 168.3| 55.5| 5100| <br> They also require a <high>formula</high> that specifies a <high>dependent</high> variable (y) as a function of one or more <high>independent</high> variables (x1, x2, ...) in the form: <p align='center'><font size = 6>formula = y ~ x1 + x2 +...</font></p> ] .pull-right55[ How to create a statistical object: ```r # Example: Create regression object (my_glm) my_glm <- glm(formula = income ~ age + height, data = baselers) ``` <!-- --> ] --- # What is machine learning? .pull-left55[ ### Algorithms autonomously learning from data. Given data, an algorithm tunes its <high>parameters</high> to match the data, understand how it works, and make predictions for what will occur in the future. <br><br> <p align="center"> <img src="https://raw.githubusercontent.com/therbootcamp/therbootcamp.github.io/master/_sessions/_image/mldiagram_A.png"> </p> ] .pull-right4[ <p align="center"> <img src="https://raw.githubusercontent.com/therbootcamp/therbootcamp.github.io/master/_sessions/_image/machinelearningcartoon.png"> </p> ] --- # Today <p><font size=6><b><a href="https://therbootcamp.github.io/BaselRBootcamp_2018July">Schedule</a>